5 Chapter 4 The Human and The System Geography
Nearly anything you can think of is part of a system. Thinking about things as parts of systems (systems thinking) gives us a number of advantages over considering everything in isolation. First, it provides insight into the unit’s function as part of the system. For example, insects may not seem important, or might even seem to be a nuisance, until their roles in feeding many other animals, decomposing dead organic matter, and pollination are considered. The same is true for the contribution of a small stream to a larger river and eventually the water cycle.
Let’s look at a generic diagram for a very basic system:
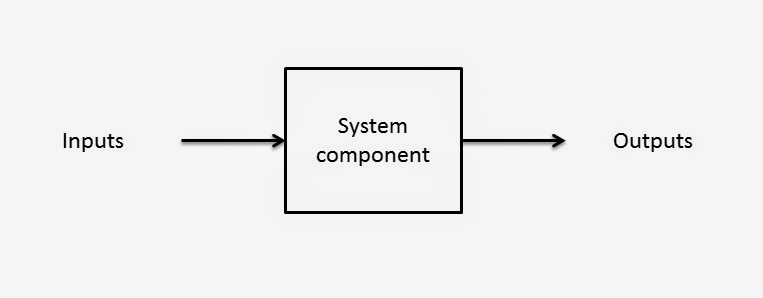
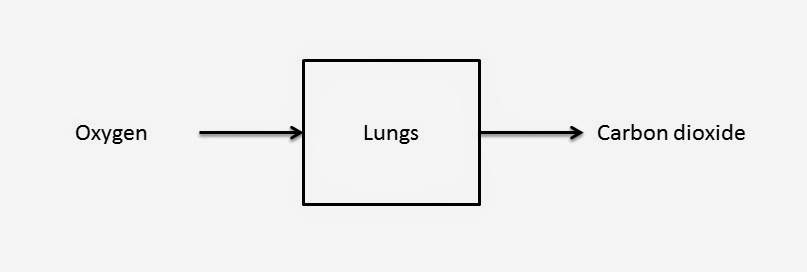
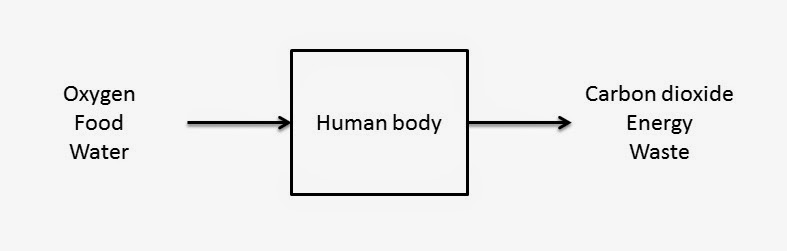
This is a little abstract but we can see that there are things that go into systems and things that come out of them. Here are some more concrete examples:

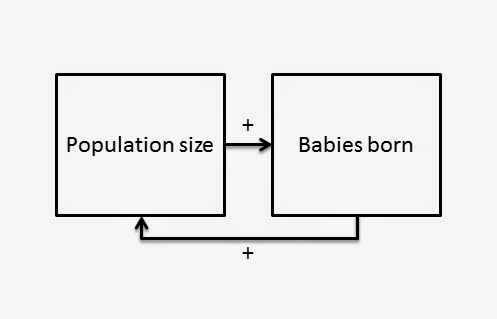
Causation and System Feedback
Feedback is an essential part of systems–without it, systems would not function at all. Feedback describes the “signal” that a unit of a system receives from other parts of the system, and can be positive or negative.
Let’s take a look at some simple diagrams to understand relationships in systems. First, the arrows in the diagrams above have been showing the flow of inputs and outputs, short for “goes into” and “comes out of.” We’re going to ad a + or – sign to these arrows, which is a short hand way of saying “increases” or “decreases.” For example, to return to the system of our human body,

The plus sign indicates a positive relationship that we have all experienced. We can read this two ways: “increased exercise leads to increased body temperature,” or also “decreased exercise leads to decreased body temperature.” Either way the relationship is positive, as more of one thing leads to more of the other and vice-versa.
Fortunately our bodies have a way of responding to increased temperatures, diagrammed below:
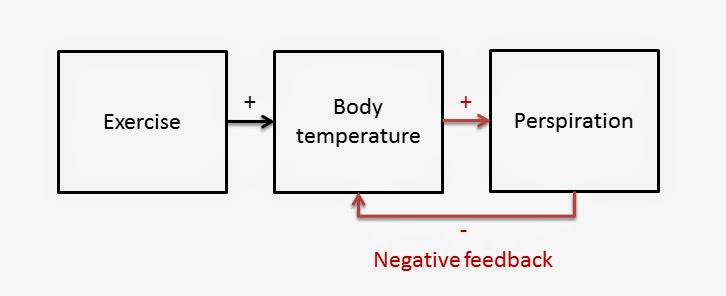
When our body temperature rises, we perspire (sweat) in response. The plus sign between body temperature and perspiration indicates that normally when body temperature increases, perspiration increases, and when body temperature decreases, so does perspiration. This is another positive relationship. Following the entire chain, we can see that more exercise leads to more perspiration.
Perspiration cools our bodies through evaporation. That’s shown with the – sign, which can be interpreted as “increased perspiration decreases body temperature.” The negative sign indicates a negative relationship–more of one thing is associated with less of another.
The lower arrow returning from perspiration to body temperature is an example of a feedback loop because it returns to an earlier part of the system chain. Feedback is essential to the functioning of systems and it’s hard for us to understand how systems work without understanding their feedback loops. Body temperature being regulated by perspiration is an example of a negative feedback loop. Negative feedback tends to maintain equilibrium in a system. In the case of our examples, normal body temperature is maintained by negative feedback.
Positive feedback, on the other hand, is one in which feedback serves to accelerate change in a system, moving it further from its original operations. To expand on the previous example, let’s take a look at a closely related negative feedback loop for temperature regulation:
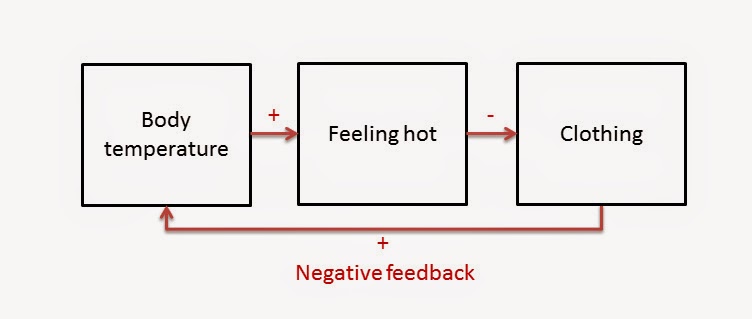
The signs get confusing here so remember how we’ve defined these relationships. Starting with body temperature, we see a positive relationship, meaning “increases in body temperature lead to an increase in feeling hot,” and conversely, “decreases in body temperature lead to decreases in feeling hot.” The next relationship in the chain shows us that “increases in body temperature lead to decreases in clothing,” or that “decreases in body temperature lead to increases in clothing.” If we feel hot, we take off some clothes. If we feel “not hot” (cold), we put clothes on. See how increases are met with decreases and vice-versa? That’s a negative relationship. Finally, to complete the feedback loop, “increases in clothing lead to increases in body temperature,” and “decreases in clothing lead to decreases in body temperature.”
Let’s modify the same example to show positive feedback:

Here we see that increases in body temperature are no longer met with increases in feeling hot. This is sometimes seen when we are sick. Instead, even as we become warm, we continue to feel cold and we bundle up, increasing our temperature further. We may even shiver, which also serves to increase our temperature. We call this abnormally high body temperature a “fever,” a good example of positive feedback. You can see how the feedback loop moves the body away from its normal temperature.
Super important to note here is that there are two negative relationships in this diagram, yet it’s still an example of positive feedback. Let’s take a moment to explore why that is. It’s easier to understand if we remember the way we interpret the plus and minus signs. Following the boxes and arrows left-to-right, we can read, “increases in body temperature lead to a decrease in feeling hot, and decreases in feeling hot lead to an increase in putting on clothes.” Thus, when we have a fever we feel cold and put on more clothes even though our bodies temperature is higher than normal! The key insight is to treat the negatives and positives like multiplying numbers. A negative number times a positive number is negative. But two negative numbers multiplied is positive, which we see in the fever example.
While sick our bodies usually regulate temperatures away from dangerously high levels, which is signalled by profuse perspiration as a fever “breaks.” What is really breaking is the positive feedback loop as the body returns to a normal temperature by using its typical negative feedback loop.
What’s all this about body temperature?
OK, OK, these examples were deliberately selected to be super familiar so you can hopefully understand the concepts more easily. Let’s look at some interesting and important examples of system feedback on Earth.
Our first example looks at two different feedback loops possible when humans deal with the physical risk of flooding on a floodplain: